We set our winner bar at 95%. A simulation talked us out of it.
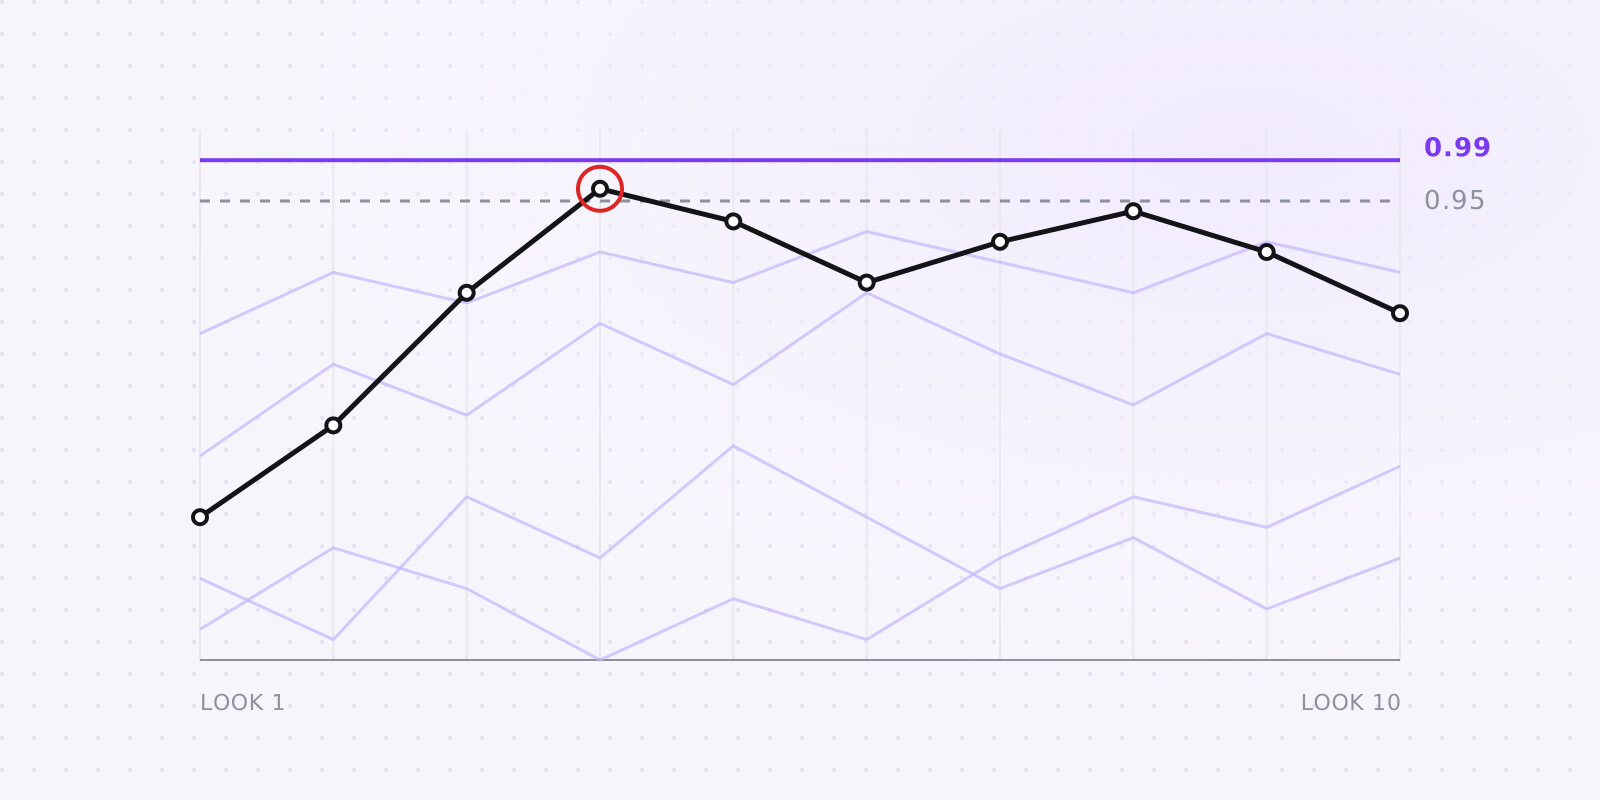
Our original spec said a variant wins once the probability that it beats control reaches 95% and the expected loss from picking it stays under 1%. Ninety-five percent is the number everyone remembers from stats class, and a Bayesian "95% chance it's better" sounds like something you could defend in a meeting, so we didn't think twice about it.
It held up fine until we tested it the way people actually use a results page.
#Two identical variants, checked ten times
An A/A test splits traffic between two versions that are exactly the same. Any winner it declares is wrong by construction, which makes it the cleanest way to find out how often a decision rule fools you.
Our simulation runs 1,000 of them. Both arms convert at a true 5%, each collects 5,000 visitors, and the rule gets evaluated ten times along the way: at 500 visitors per arm, at 1,000, and so on up to 5,000. If it says "winner" at any of those looks, the experiment counts as a false winner. That's deliberate. Imagine someone who opens the dashboard on a Tuesday and ships the first thing that turns green: the rule has to survive that person as well as the one who waits for the end.
At 95%, roughly 15% of those identical pairs produced a winner at some point. We'd expected something near 5% and got about three times that.
#Why looking more often breaks a fixed bar
Early in a test, with a few hundred visitors per arm, the posterior is wide and it swings around. A lucky run of conversions on one side can push P(beat control) past 95% for a day before it drifts back. If you check once, at the end, you'll usually miss those swings; check ten times and the noise gets ten chances to cross the line, when it only needs one.
None of this makes the Bayesian number wrong. "P(beat control) = 97%" is a correct statement about the data you have right now. The trouble starts when a product turns that number into an automatic verdict and re-evaluates it every few minutes, which is exactly what a live results page does.
#What we changed
We moved both edges. A variant now wins at P(beat control) ≥ 99% with a relative expected loss of 1% or less, and it loses at P(beat control) ≤ 1%. Rerun with identical seeds and looks, the simulation now produces false winners at or under 5%. The simulation runs nightly against the real results code, so if anyone loosens a threshold later, a test fails before the change ships.
There's also a floor before any verdict at all: below 200 visitors per arm, or fewer than 20 conversions across both arms, the state reads Not enough data, and the page estimates how many more visitors each variant needs.
A stricter bar costs time. On a small site that can mean weeks of extra waiting, and we'd still rather make you wait than have the results page tell one team in seven to ship a change that does nothing.
#Then the lift column showed +67%
A related problem turned up in the lift column. We used to show the posterior mean of the lift (θ_variant / θ_control − 1), and with four visitors per arm and identical true rates, that mean came out at +67%. Ratios of small, skewed distributions behave like this; a handful of draws where control's rate sits near zero drags the average way up.
Nobody should see +67% on a test with eight visitors. The lift now shows the posterior median with its 95% interval, and when either arm has fewer than 30 visitors, or control has fewer than 5 conversions, the point estimate becomes a dash. We kept the interval. A very wide interval tells you something true: how little anyone knows yet.
#What it means for you
Look at the results page as often as you like. The state column (Not enough data, Deciding, Winner, Loser) already accounts for repeated looks, so there's no need to schedule one "official" check.
The thresholds can't protect you from changing the question afterwards, though. Pick the primary goal before you start. If you go hunting through six secondary goals for the one that turned green, you're running six tests and keeping the lucky one, and the 5% figure no longer applies.
The marketer guide explains every column on the results page.